Digital Marketing Budgeting to Smash eCommerce Targets

Welcome to the third and final part of my blogging series around marketing measurement. So far we’ve looked at how to calculate customer lifetime value and then how to calculate the amount of digital marketing budget you’ll need to meet your targets. This blog post looks at how to proceed once you’ve got your digital marketing budget by looking at the different channels and deciding what would work best for your brand.
Step 1: What is your digital marketing goal?
Let’s start at the very beginning. Your business goals must be clearly defined before you start as different channels serve different purposes. Let’s take the example from previous posts in the series of Brand X with the SMART goal:
- Brand X’s Goal: Brand X wants to grow turnover by 50% from £850,000 to £1,275,000 (£425,000 increase) in 2016
Step 2: What is your digital marketing budget?
This all-important figure is again something that you will need to know before setting out on your budget planning journey. So let’s once again take Brand X as an example:
- Brand X’s Budget: Brand X has a yearly marketing budget of £159,375
Step 3: What digital marketing channels have driven sales in the last 12 months?
Hopefully you have Google Analytics eCommerce Tracking set up to enable you to track eCommerce revenue and transactions. This data is essential to measure the success of previous digital marketing campaigns and in doing so, plan for future success. Here’s the best way to find what’s working for you:
- Look at the report found in Google Analytics > Acquisition > All Traffic > Channels
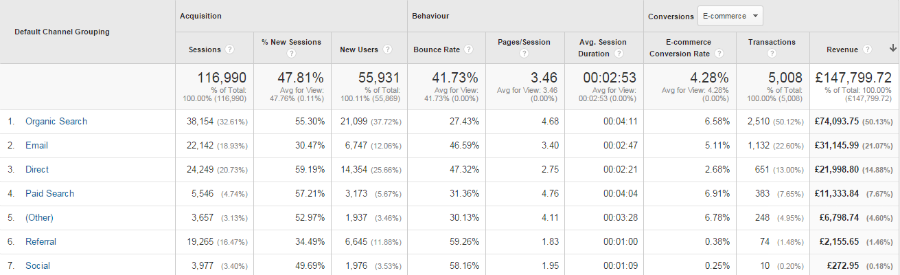
- Select “eCommerce” under the conversions section and you can clearly see the most valuable channels for generating revenue. If you sort this by revenue rather than by the default of sessions (traffic) then maybe your most valuable channel isn’t the same one that drives the most traffic.
- Look deeper into each channel source, particularly paid search and referral sources and you can see the success of bidding on different keywords and the value of certain directory listings or blog coverage. Some sources may be sending traffic but are they sending traffic that converts?
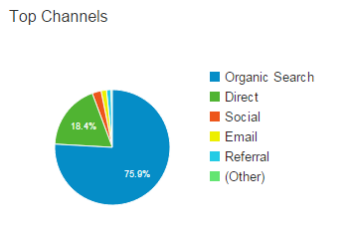
- Look at what kind of split there is between the channels. What percentage is each channel source delivering in annual revenue?
 Of course, it is worth considering that this report shows conversions based on “last click” attribution which will not account for the overall customer journey across channels, only what channel they converted from.
Step 4: Evaluate and understand the pros and cons of different channels
SEO
Percentage of online revenue you can expect SEO to drive: 40% - 80%
If an eCommerce site is optimised at product and category level, SEO will typically drive between 40% - 80% of the total website revenue. As your domain gains more authority over time you will naturally rank for tens of thousands more keywords, driving even more revenue. SEO is typically the channel which will drive the lion’s share of sales for eCommerce websites. This is largely as SEO can target consumers who are searching in Google for terms which show clear intent to buy. Here’s an example of different types of keywords which you might optimise your website for and the purchase intent different keywords typically have…
| eCommerce Page | Keyword Example | Search Volume | 1st Visit Conversion Rate |
|---|---|---|---|
| Category | Equestrian clothing | High | Low |
| Sub Category | Horse riding jackets | Medium | Medium |
| Brand Category | Mark Todd riding jackets | Medium | High |
| Product | Mark Todd Blouson Jacket in Red / Navy / Green | Low | Very High |
| Content i.e. Blog Pages or Buyer’s Guides | Best technical clothing for horse riding (links to sub category/products) | Low | High |
PPC
Percentage of online revenue you can expect PPC to drive: 0% - 80%
Pay per click can be a great way to instantly drive sales, but the channel does not suit everyone. Considering your existing brand awareness, website conversion rate, competition and amount you have available to spend may result in the realisation that PPC is not a viable option. However, PPC is a channel which is definitely worth testing as for many eCommerce businesses, PPC is the main source of online revenue driving millions of pounds in online sales year after year.
Percentage of online revenue you can expect email to drive: 10% - 30%
Email is consistently voted as one of the channels that delivers the best ROI year after year.
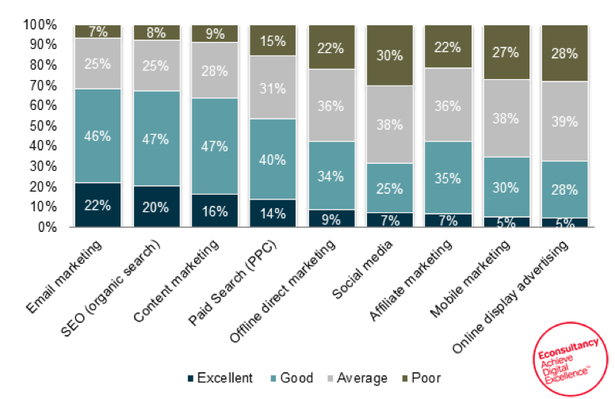
The beauty of email campaigns is that your customers have asked to hear from you. They have signed up because they’re engaged with your brand and products, combine this intent with the data you know about your email customers (gender, birthday, purchase history, opens, clicks and preferences to name a few) and you’ve got great opportunities.
Social Media
Percentage of online revenue you can expect social media to drive: 0% - 10%
People are often surprised to learn that social media is not a big driver of revenue, in fact research from Forrester found that social media generated less than 1% of online sales1. Research like this demonstrates how social media is a channel which is most appreciated when looking at goals around brand awareness and relationship building. However, many new customers can be found through social media by utilising your existing customer base and it’s a good way to build trust with your audience. Often the bridesmaid and never the bride, social media is typically a key point in the customer journey, but due to last click attribution, will not likely be credited with the sale.
Affiliate Marketing
Percentage of online revenue you can expect affiliate marketing to drive: 0% - 20%
Affiliate marketing campaigns are often a way to reach a vast new audience. For example voucher code websites may have a customer database of a million people, many of whom have never heard of your brand until the voucher code company promote your brand to their audience. On the negative side of the equation, you are giving away a chunk of your revenue away in affiliate commission in exchange for the referral and providing discounts or special offers may not be appropriate for certain brands.
Step 5: What channels should you invest in to increase eCommerce revenue?
Here we take a look at the percentage split across channels which we have typically seen from working across a wide range of eCommerce websites and have included an example digital marketing budgeting strategy for Brand X.
| Digital Marketing Channel | Revenue Typically Generated By Channel | Typical Budget Weighting % | Yearly £ Budget For Brand X Example | Brand X Budgeting Strategy Insights |
|---|---|---|---|---|
| PPC | 0% – 80% | 0% - 80% | £72,000 |
|
| SEO | 40% – 80% | 10% - 30% | £36,000 |
|
| Social media | 0% - 10% | 1% - 20% | £16,000 |
|
| Web Development / Maintenance | N/A | 10% - 30% | £12,000 |
|
| 10% - 30% | 1% – 20% | £6,875 |
| |
| Design | N/A | 1% – 10% | £5,000 | Important for brand engagement and will require investment for maintenance. |
| Photography | N/A | 1% – 5% | £5,000 | Important for conversion rate and will require investment for maintenance. |
| Content | N/A | 1% – 10% | £5,000 | Could be included under SEO/social media or split separately depending on your set up, investment will always be required to communicate benefits to customers. |
| Analytics | N/A | 1% – 10% | £1,500 | Investment needed to ensure accurate tracking of campaign success and ongoing decision making. |
| Affiliate Marketing | 0% - 20% | 0% - 10% | £0 | Not applicable for Brand X this year, but could be a potential channel to test in the future. |
| TOTAL | N/A | 100% | £159,375 |
Every brand is different and depending on the landscape of your industry, competition and audience, strategy will of course differ. It is also worth noting that your budget goes further with good integration across channels and tying these together will infinitely improve your customer journey.
Thanks for reading
If you’re interested in putting a digital marketing budget together and what the realistic outcomes could be, contact us for free digital marketing analysis and revenue forecast.